


Bubble or No Bubble? The Great Chinese Property Debate
release time : 2019-04-09 view count : 1230 次
UBS Investment Research Global Economics Research
China
Hong Kong
25 March 2011
Tao Wang
Economist
S1460511010018
wang.tao@ubssecurities.com
+8610-5832 8922
If one does not think about the future, trouble will arrive soon
— Confucius
China has had a property construction boom for much of the past two decades and property construction is arguably a growth engine as powerful as exports for the overall economy. Rapid income growth and growth of urban population were the two most important factors behind the property boom, while the housing reform in the late 1990s helped to unleash the huge pent-up demand for modern commodity (private) housing.
How long can the property boom last? Or has China already built a big nationwide property bubble that is about to burst? Well, we do not think there is a big bubble today but think it may be difficult to avoid one over the next few years.
Identifying a property bubble before it bursts is always difficult. At the moment, looking at the usual indicators such as housing prices (and derivative indicators such as affordability ratios), construction activity and household leverage, we do not think China has built a big nation-wide bubble. The sharp rise in housing prices in 20092010 led the government to restrict commodity housing purchases in large cities, which is likely to have a negative impact on commodity property construction. But the push for large-scale social housing construction is expected to give support to overall property construction in the next couple of years.
In the coming years, we think the risk of a property bubble is very high. The poor data quality makes us less comfortable with the benign picture the data presents, and recent property sector developments show some alarming signs. Most importantly, various rounds of property sector measures have not addressed many of the fundamental issues, and these factors provide fertile ground for a property bubble somewhere down the road.
China’s potential property bubble may not be “standard”, that is, massive overleveraging and overpricing leading to a financially-driven collapse. Rather, given the sheer size of the property and construction sector and its heavy role in driving growth, even just having housing demand “fade away” because of changes in policy or asset preferences could already lead to a hard landing of the overall economy.
Predicting the timing and trigger of a bubble is difficult. We think it is important to closely monitor construction activity across the country, along with developments in housing prices and bank credit.
The property boom
China has had a property construction boom for much of the past two decades, and rapid growth in property construction has been widely seen as an engine of China’s growth over the past decade, along with exports. Construction and real estate value added accounted for about 12% of GDP in 2009, but its overall importance, taking into account the impact on other sectors, is estimated to be considerably higher (we estimate that the property sector accounts for more than a quarter of final domestic demand in China). For example, according to the latest (2007) input-output tables, about 21% of the output of non-metal products, 16% of metal smelting and processing, and 8% of transport and storage goes into the property sector (Chart 1).
Real estate investment accounts for more than 20% of fixed asset investment (reported monthly and quarterly) and almost 20% of fixed capital formation (reported annually along with GDP). But, again, investment in many heavy industrial sectors is because of demand in property construction. If we strip out real estate investment, then overall fixed investment as a share of GDP would be 10 percentage points lower, though its rising trend would still remain intact (Chart 2).
Chart 1: Top 5 industries with the largest direct exposure to real estate & construction

Chart 2: The importance of property investment

The most important factors behind the property construction boom in the past two decades are rapid growth of income and the urban population. China’s per capita real GDP grew by 9.6% a year since 1990. In USD terms, per capita GDP rose from $350 in 1990 to roughly $1,000 ten years later and more than $4,000 in 2010. Urban population grew from about 300 million in 1990 to more than 620 million in 2009. The number of urban households rose from 76 million to 215 million in the meantime.
Rapid growth of income and urban population led to ever rising demand to house more people in better and larger living conditions. In addition, the expansion of economic and commercial activity nationwide and especially in urban centers required more and better office and commercial spaces.
A general construction boom had already started in the 1980s, after more than a decade of stagnation in investment and urban construction. However, the housing market reform in the late-1990s resulted in a large one-off asset transfer from the state to parts of the urban population. Housing allocation through the government and state-owned employers officially ceased in 1998 and private (commodity) housing construction started in a major way around that time. The housing reform unleashed huge pent-up demand for modern private residential housing (Chart 3). The development of mortgage lending helped as well (Chart 4).
Chart 3: Commodity housing construction surged since late1990s housing reform

Chart 4: The rise of mortgage lending helped

Another angle to look at the importance of residential construction is from the households’ point of view. UBS chief emerging market economist Jonathan Anderson pointed out that over the past dozen years, an increasing share of China’s household spending was devoted to buying property at the expense of household consumption. Our own estimates show that while household consumption declined steadily as a share of GDP over the past decade, overall household spending including housing remained stable (Chart 5).
However, the nature and sustainability of household consumption and spending on housing are different. We can group the two together to explain the household-led demand of the past, but this is not a good guide for predicting future household demand. Consumer spending is usually recurrent, hence, more sustainable and less volatile, and tends to be proportional to household income. Housing purchasing is not recurrent, and therefore is counted as investment1. Over the past decade and half, part of the massive urban residential housing boom is one-off as pent-up demand got satisfied and as households shifted part of their wealth to formerly non-existent private housing (Chart 6). In addition, household has increased its leverage in the form of mortgage borrowing to finance its spending (Chart 4 above). As such, the process cannot continue as we have seen. As some of the factors taper off, one can not expect home purchase to take an ever-larger share of household spending in the future.
1 The housing “service” provided by one’s home is estimated and included in consumption, though in China we think the weight of housing consumption is underestimated.
Chart 5: Household consumption and housing spending

Chart 6: Changing composition of household wealth

Does China have a property bubble?
After more than a decade of property boom, has China built a big nationwide property bubble and is it about to burst? A year ago, we tried to answer this question in “Ten Big Questions on China s Property” (UBS Asia Perspective, 13 May 2010). A year has passed since then and the government has taken various measures to try to cool the property market, but doubts continue to gather. The continued attention and confusion, as well as new developments and understanding about the issue warrant an update. Identifying a property bubble before it bursts is always difficult, but there are a few important indicators to watch.
Housing prices
Usually, an extended period of rapid housing price increases could be an alarming signal of a housing bubble. In the case of China, official statistics show that the average price for new residential housing in urban areas grew by an average of 9% a year in the past decade, and at double digits in 2009. In an economy where urban household disposable income growth averaged more than 10% a year, such a pace of housing price growth does not look out of place (Chart 7).
However, the official housing price data is not adjusted for location or quality. Since the majority of sales are new properties that over time tend to be built further and further away from city centers, the official price data does not capture well how house prices rise over time. Centaline, the largest real estate intermediary in the secondary market, also publishes average prices for secondary home sales for some large cities. Their data show that average prices in large cities have grown much faster than indicated by official housing price data for these cities (Chart 8). However, the Centaline data has only limited coverage, which means we end up using the official data most of the time.
Chart 7: Official housing prices have outpaced householdincome

Chart 8: Two sets of price data

A popular indicator used to judge a property market bubble is the affordability ratio – calculated by dividing average home prices over average disposable income. Chart 9 below shows the ratio of average prices of a 100 square meter apartment in cities over the average urban household disposable income, which is basically a different way of presenting data in Chart 7. One frequent remark on China’s property market is how high average home price is compared to average income – on average, it will take 9-10 years of income to buy an average sized apartment, and in large cities, this could be up to 20 years (Chart 10). In developed economies, this ratio is typically 4-6.
The implication of this is that very few people can afford to buy property, and since sales have been brisk, that must mean households are accumulating a lot of debt for home purchases. We all know what happened when households borrowed to buy homes they could not afford in the US and in some European countries. But in the case of China, data on household leverage (more below) and on-the-ground fact check tell a different story: households usually put at least 30-40 percent as down payments for home purchase, and household balance sheets are pretty healthy.
Well, the affordability index for China is highly flawed – both the numerator and denominator have serious data issues. On the numerator, we already know that average prices are based on sales of mostly new commodity housing, and not adjusted for quality that changes over time. The issues with the denominator are arguably even bigger. Basically, the official data tends to under-estimate household income, especially the incomes of higher income population; and the average household that buys a home is not a household with an average income.
The household income data are from the National Bureau of Statistics’ household survey, which under-estimates “true” household income by the agency’s own admission. The under-estimation is reportedly more serious for the higher income population. Some researchers estimate that “grey income” is significant and has not been included in the official statistics (see Wang Xiaolu, 2010, “Gray Income and the Household Income Gap”, National Economic Research Institute). The NBS disputes these claims but its own comprehensive flow of funds data from the national accounts suggests a higher household income than implied from the household survey.
Chart 9: Implied affordability index looks alarming


Moreover, given that the private housing market only got started in the late 1990s, the penetration of such housing is still low. Commodity housing is still targeted mainly at the upper and upper-middle income urban population. The cumulative completion of commodity housing between 1997 and 2010 is about 54 million units, compared to 215 million of total urban households. According to official statistics, the average income of the top 20 percentile of the urban population is 2.2 times of the average urban income, and that of the top 40 percentile is 1.7 times of the average. For people in the top 30-40 income percentile, the affordability index would measure 45, very much the international norm.
The above helps to explain why in the face of relatively high housing prices, we continued to see brisk sales with modest credit backing.
We think the data reveals two additional issues. One is that there is a mismatch in the commodity housing market between increasing demand from middle income population and available supply biased toward the high end. The second is that the income distribution is highly unequal, and has likely become worse over time. Both are serious issues, but the point is not that households are buying properties they can not afford using money they do not have – the cause of the recent property bubble in the US and other countries.
What about large cities? The very high and rising prices in some large cities have led to public complaints, and triggered the property tightening measures over the past year. One reason may be that cities like Beijing, Shanghai and Shenzhen attract wealthy investors from other regions (and overseas), much like New York and London attract property buyers from everywhere. For these cities in China, one added attraction is the concentration of services such as higher education and healthcare in these cities.
Another indicator related to housing prices is the rental yield, the return to a property asset. Data on rental yield is poor, but according to Centaline, rental yields in tier 1 cities have been low and have dropped recently to below 3% (they are close to 2% in Shanghai) (Chart 11). Low and declining rental yields are a bad sign for the housing market.
Chart 11: Rental yields have dropped

Housing leverage
Past experience shows that a credit boom almost always accompanies or predicates a property bubble. Do the high and rising property prices and deterioration in affordability in large Chinese cities mean that China’s housing boom is also buoyed by a credit bubble?
In the case of China, mortgage lending in general has outpaced overall bank lending over the past 10 years, mainly because mortgage lending started from scratch a little over 10 years ago (Chart 4 above). During 20092010, as the government lowered payment requirements and cut interest rates, mortgage lending grew very rapidly, but it has slowed in recent months following restrictions on second and third mortgages and higher interest rates. Lending to property developers has also slowed in recent quarters (Chart 12).
Chart 13 shows household mortgage relative to their disposable income. Two things are immediately noticeable: household leverage ratio is still at a moderate level at end 2010; but it did surge in 2009 and 2010 – a credit boom was behind the housing market boom in these years. The sudden rise in household leverage suggests that given time and opportunity, Chinese households could rake up debt rapidly.
There are two more comforting pieces of data. First, importantly, new mortgage finance relative to the value of commodity residential sales, our proxy for loan-to-value ratio, has come down in 2010 after surging in 2009 (Chart 14). This is consistent with our belief that affordability is not an issue for most of the actual home buyers. Second, overall direct bank exposure to the property sector is still relatively stable even after recent increase in property related lending (Chart 15).
However, banks’ indirect exposure to the property sector could be significantly larger. Loans to many local government investment platforms and to the corporate sector are often backed by land and property collateral, and borrowing by these entities for general fixed investment could be diverted to property development. In addition, given the importance of the property sector as the final destination for many industrial products, investment of and credit to many heavy industrial sectors are indirectly exposed to the property sector as well.
Chart 12: Property loans grew rapidly but have slowed

Chart 13: Household leverage rose sharply but is still moderate

Chart 14: Mortgage loan-to-value ratio is relatively low
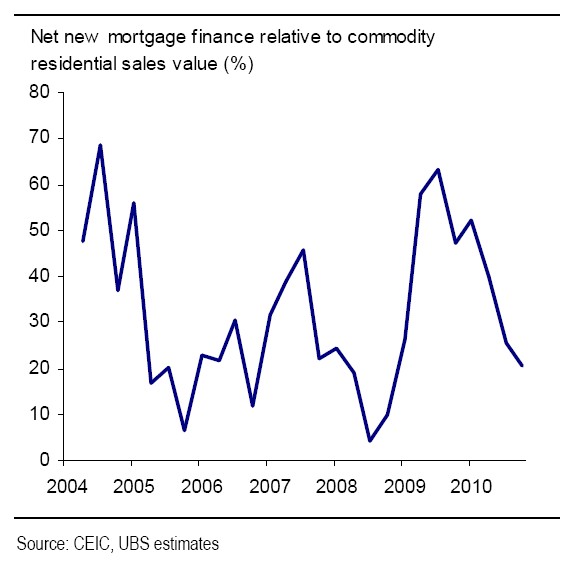
Chart 15: Banks direct exposure to property lending is still moderate and stable

Construction activity
Another sign of property market bubble is a period of sharp and sustained rise in construction activity. Just before the Asian financial crisis, the economies that later saw a property market bubble burst all experienced a surge in construction activity to a dangerously high level, relative to GDP (Chart 16). In the case of China, construction activity as a share of GDP has stayed relatively stable in the past decade, picking up somewhat in the last couple of years. Compared with countries prior to the Asian financial crisis, China’s activity level does not look that alarming. However, we have seen a steady rise in the trend. Looking ahead, a continued rise would bring China into worrisome territory on this metric.
Alternatively, we can look at the amount of physical construction rather than value added. Comparing construction per capita, China is building about 1 sqm of housing per capita on average over the past decade, perhaps up to about 1.3 sqm per person in urban areas in the past 2 years. This is compared to a likely figure of around 1.5 sqm per capita in the US and Spain before their bubbles burst (Chart 17). Of course, given that China is a country that is going through rapid urbanization, the comparison with developed economies may not be all that appropriate.
Our discussion on China’s property sector has focused on urban residential construction. Rural residential construction per capita has stayed at 1 sqm for more than a decade, but in 2009 this figure shot up to 1.4. This sharp increase may be related to the stimulus package that delivered more growth to rural areas, and/or related to front-running of rural residents in housing construction, in the hope that they will receive more compensation when local governments procure their land for urban construction. The latter is a phenomenon with ample anecdotal evidence across many regions.
Chart 16: Construction as a share of GDP

Chart 17: Construction per capita

Housing stock
Earlier this year some investors sounded the alarm about China’s high housing stock value as a share of GDP, and compared it to that of Japan before its property bubble collapsed. Our own estimates put China’s stock of (urban) residential property much lower, at about 75% of GDP (Chart 18). Here is how we arrive at our estimate. We take the total amount of residential floor space in 1985 and add to it the cumulative completion of residential housing since then (1985 is when China started to publish annual completion data) – which is almost 12 billion square meters. Assuming a 3% depreciation rate, we get our adjusted urban housing stock in square meters. If we value the entire housing stock at the prevailing market price for newly built commodity residential properties, then China’s housing stock is almost 120 percent of GDP. Considering that some of the houses built in the 1980s and early 1990s were of poorer quality and that the stock also includes dorms and lower quality rentals, we estimate an adjusted housing stock value at about 75% of GDP in 2010.
In principle, the valuation of housing is relevant for a risk assessment of a housing bubble, and we would expect the value of the stock of housing in China to be much lower than in developed countries. However, different assumptions about depreciation and housing values can lead to different estimates (as shown above). Moreover, how housing stock value differs between countries is influenced by many factors, including the depth of the financial sector, the tax regime and other elements in the policy setting. We do not think this is a good indicator for assessing a property market bubble.
How about the physical stock of residential housing? The numbers here make us somewhat less sanguine. We estimate that China has built a cumulative of 120-140 million units of urban housing since 1990, on top of more than 80 million units that existed before then. This is a large number, compared to a total of 215 million urban households in 2009. Of course, many old units were barely livable and many have been torn down in the meantime, and more than 10 million people will be “urbanized” each year in the coming years. Nevertheless, the phase of rapid build up of urban housing to satisfy the pent-up demand may be close to an end.
Chart 18: The value of housing stock

Will China have a property bubble? Short-term bull, medium-term bear
To summarize the previous section, although there are some signs of alarm, and while there may be some ghost towns and localized property bubbles, at the aggregate level, it does not seem that China has built a big nationwide property bubble.
Can China avoid a property bubble in the medium term? We think it will be difficult.
In the short term, we think the risk of a property bubble burst is small. The rapid credit expansion in the property sector and the surge in sales and prices have been reined in by government measures. At the same time, the ongoing property tightening measures are unlikely to bring a sharp drop in property construction – the government is balancing restrictions on commodity housing purchase with a push for social housing construction (Chart 19). We think the pick up in social housing construction this year and next will more than offset the likely weakness in the commodity housing sector (Table 1, see more details in “All about Social Housing”, 10 March 2011). Home prices are unlikely to fall significantly as the leverage in home purchase is relatively low, income is rising rapidly, and expectations of future price increase remain very strong.
Chart 19: Social housing is planned to cover 20% of urban household by 2015

Table 1: 2011 Social housing construction plans

However, in the next few years, we think the risk of China accumulating a large property bubble is quite high. Even as the government attempts to stabilize housing prices with various administrative and supply side measures, we think the following fundamentals provide fertile ground for a property bubble in China:
A high share of deposits on household balance sheet The combination of a high saving rate, an underdeveloped capital market and a closed capital account means that a large share of household wealth still exists in the form of bank deposits, implying a large deposit overhang (Chart 20). As “investment” or asset-diversification demand for housing rises, the shift from bank deposits to property assets could cause a bubble without much household leverage, as increased flow of funds to property lead to higher property prices, which in turn attracts more funds.
Low deposit rates (low alternative returns) The largest form of household liquid assets, bank deposits, has a very
low return. The government sets a ceiling for deposit rates at
commercial banks, and the real deposits rate has often been negative
(Chart 21). Low deposits rates, together with the lack of a property tax
and other carrying costs, make people tolerant of low rental yields and
facilitate the shift of saving from banks to property assets. The lack
of adequate rental yields also reduces the supply of rental properties
and adds to scarcity of housing resources in the market. The frequent
stories about empty apartments hoarded by investors are a
testament to this.
Chart 20: A large share of household wealth exists as bank deposits

Chart 21: Real deposit rates are low or negative

Local governments’ incentive to push up land prices and construction activity There are at least three major reasons why local governments can and would want to do this: (1) they are the monopoly suppliers of land for urban property construction. For urban development (residential and commercial), suburban land has to be first “procured” by the government before it can be auctioned off to the most suitable bidder; (2) they rely heavily on land revenue for discretionary investment spending (Chart 22). Land revenue is not included in the governments’ general budget, but put in a separate “fund” budget, and as shown in table 2, much of the land revenue at the local government level is used for land development, urban infrastructure, and other investment and projects; (3) they charge commercial and residential sectors heavily for land but provide land to industries virtually for free.
Local governments cross subsidize partly because their most important source of revenue for the general budget are value-added taxes and corporate profit taxes collected from industries.
Table 2: 2010 local government land sales revenue and related expenditure (RMB billion)

Chart 22: Land sales made up 30% of local government’s finances in 2010

High corporate saving channeled into property related activity. The corporate sector has high saving and retained earnings, reflecting strong underlying profitability and distorted factor prices as well as low or no dividends in the case of state-owned enterprises. In recent years, the corporate sector has been increasingly attracted to invest in land and property, partly because of inadequate corporate governance and entrance barriers in many other sectors.
The bias toward the construction aspect of urbanization The government has identified urbanization as the central theme and driver for domestic demand and growth in the coming years, and this is often interpreted by local governments and the general public as “urbanizing” suburban areas with property construction. The government has a target for the “urbanization rate”, and each local government will likely strive to exceed its own target. In a country where employment data is poor, and the identity of “urban” or “rural” (Hukou) is not determined by where one lives and works but more by where one is born, measuring the rate of urbanization is challenging. For the government, an easier measure is the physical appearance, or the construction of urban-type housing clusters and infrastructure. This bias could lead to an accelerated build up in the property sector that could not be sustained in a few years.
The intentional and mandated segregation of urban and rural land and housing markets Rural land can not be used for commodity property construction before it has been “procured” by local governments, and when suburban rural residents no longer work in the field and build houses, these houses are not allowed to be sold to urban residents. In the latter case, city governments do not treat such communities “urban” in their plans for providing infrastructure such as schools, hospitals, heating, and waste and water treatment. The separation constrains supply of urban housing and pushes up urban housing prices. At the same time, discounting this rural housing stock and property construction could lead to overbuilding in the overall property sector.
Against the general background of ample liquidity, low interest rates, and the focus on the urban property construction aspect of “urbanization”, it may be very difficult for China to avoid a property bubble in the coming years, particularly if policies do not address the fundamental issues above.
What to watch for and what might be the trigger? A property bubble with “Chinese characteristics”
How will this end? We do not think that a property bubble in China will come and go in the “standard” way, that is, massive over-leverage and overpricing leading to a financially-driven collapse. Given that households have strong balance sheets and have usually put down at least 30-40% of their own cash into home purchase, they are unlikely to walk away from servicing their mortgage debt or be forced to sell their homes easily. Compared with economies where a property bubble was led by a housing credit bubble, we think the risk of large defaults on mortgage loans and large foreclosures is small.
Rather, given the sheer size of the property and construction sector and its heavy role in driving overall growth, even just having housing demand “fade away” because of changes in policy or asset preferences could already lead to a hard landing of the overall economy. This, in turn, could have a serious negative impact on banks’ asset quality.
A possible scenario is that one day, household sentiment toward additional properties shifts and demand for homes drops sharply. In such a scenario, the property sector finds itself with too much supply, and more importantly, all the related construction material and heavy industry sectors that sell to property construction find themselves with extra inventory and excess capacity. Banks’ lending to these sectors and companies will then run into trouble. This is especially so since Chinese banks tend to rely heavily on collateral value in their general lending. Adding banks’ exposure to these sectors, the share of banks’ portfolio that is affected by a property bust would be quite large.
Of course, this does not necessarily mean that China will have a banking or debt crisis as a result. The non-performing loan ratio in the banking system is currently low, most banks are state- or majority state-owned, public debt is moderate and fiscal deficit is small, and China has high domestic saving and current account surplus. These factors mean that the risk of a banking sector meltdown spreading to a debt or balance of payment crisis is quite small. Nevertheless, a property bubble burst would likely bring serious damage to the banking system, and having to repair banks’ balance sheet in addition to absorbing all the excess capacity in the economy would leave China on a sub-potential growth path for at least a period of time.
What could be the trigger? An exact trigger is difficult to predict. An aggressive credit tightening, a sharp rise in interest rates, the opening of portfolio outflows, a sustained good performance in equity market or other asset market that draws funds away from property to other assets, are all possible candidates. It is also possible that at some point housing prices stop rising, and the real negative returns on housing asset stops further household portfolio allocation from bank deposits and other assets, and housing demand drops.
Of course currently at least on the surface, there are no sustained credit boom and alarmingly high leverage in the property market. This means that the process of a bubble accumulation and burst in China could be less sudden and more drawn out than in other economies. In addition, if the current plan of social housing construction is carried out faithfully, the increased supply of low cost housing could help to stabilize housing prices and influence market sentiment gradually.
What should we watch? We should continue to watch all the indicators we mentioned in the previous section, not necessarily the level, but the trend over time.
Most importantly, given the poor quality of the price related data, we should watch closely construction activity and credit expansion. So far our two key indicators are our UBS property construction index and monthly bank lending. However, our property construction index uses activity data from urban commodity housing market, which could become less useful in tracking future developments as social housing and construction in rural areas become more important, which are not adequately covered in commodity housing data. Also, office and commercial space are mostly constructed outside of the commodity housing market since companies, local governments and related entities often engage in such development on their own. Chart 23 gives a picture of overall property construction nationwide, both urban and rural, and both commodity housing (only applies to urban areas) and non-commodity housing. We will have to watch nationwide completion and construction more closely in the future.
Chart 23: Nationwide completion of floor space, 2009

_____________________________________________________________________________________
Analyst Certification
Each research analyst primarily responsible for the content of this research report, in whole or in part, certifies that with respect to each security or issuer that the analyst covered in this report: (1) all of the views expressed accurately reflect his or her personal views about those securities or issuers and were prepared in an independent manner, including with respect to UBS, and (2) no part of his or her compensation was, is, or will be, directly or indirectly, related to the specific recommendations or views expressed by that research analyst in the research report.
Required Disclosures
This report has been prepared by UBS Securities Co. Limited, an affiliate of UBS AG. UBS AG, its subsidiaries, branches and affiliates are referred to herein as UBS.
For information on the ways in which UBS manages conflicts and maintains independence of its research product; historical performance information; and certain additional disclosures concerning UBS research recommendations, please visit www.ubs.com/disclosures. The figures contained in performance charts refer to the past; past performance is not a reliable indicator of future results. Additional information will be made available upon request. UBS Securities Co. Limited is licensed to conduct securities investment consultancy businesses by the China Securities Regulatory Commission.
Company Disclosures
____________________________________________________________________
Issuer Name
China (Peoples Republic of)
Source: UBS; as of 25 Mar 2011.